The presentation of data is considered to be just as
important as the data analysis itself. In this blogpost we will look at 5
examples from Ron Cody’s “Learning SAS by Example: A Programmer’s Guide” which
will help us summarize data and create meaningful reports out of it. The main
topics we will cover are as follows –
- Summarizing Data
- Counting the Frequencies
- Creating Tabular Reports
- Problem
- Code
- Result
- Learning
Summarizing the data
In this section we will try to understand how Proc Means can be used to summarize data using various commands
1) Using the SAS data set College (available in the link at the bottom), we will report the mean GPA for
the following categories of ClassRank: 0–50 = bottom half, 51–74 = 3rd
quartile, and 75 to 100 = top quarter. This is done by creating an appropriate
format. We will not use a DATA step.
Code

In the first proc step, we are creating the 3 constrains and naming them accordingly which will serve as the 3 row names in the result. In the second proc step we first declare what descriptive analysis we need to do, in this case n and mean. Later we are specifying how they will be categorized by using CLASS function instead of a BY function. var stands for variable. It tells SAS which variable to be taken for analysis.
Result

Learning
In this exercise we have learnt how to use descriptive statistics related to Proc Means and classify that data based on the desired variables.
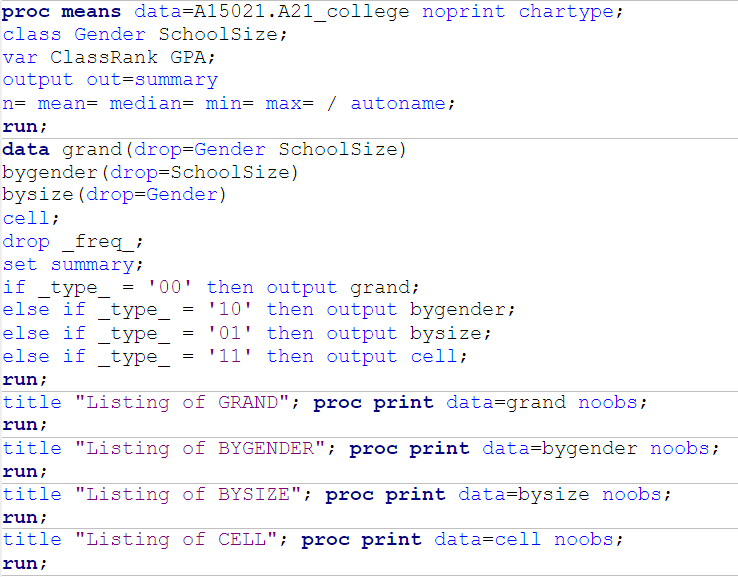
2) Using the SAS data set College we will create four summary data sets containing the number of non-missing and missing values and the mean, minimum, and maximum for ClassRank and GPA, broken down by Gender and SchoolSize. The first data set (Grand) will contain the statistics for all subjects, the second data set (ByGender) will contain the statistics broken down by Gender, the third data set (BySize) will contain the statistics broken down by SchoolSize, and the fourth data set (Cell) will contain the statistics broken down by Gender and SchoolSize. We will do this by using PROC MEANS (with a CLASS statement) and one DATA step.
Code
Result

Learning
In this exercise, we have learnt firstly how to create multiple tables in a single data step. Secondly, how to effectively use If - Else statements to fill in every table by the requirement
Counting the Frequencies
In this topic we will try to understand how Proc Freq can be used for the purpose of creating meaningful tables to summarize the data.
3) Using the data set Blood, we will produce frequencies for the
variable Chol (cholesterol) using a format to group the frequencies into three
groups: low to 200 (normal), 201 and higher (high), and missing. We will run PROC FREQ
twice, once using the MISSING option, and once without to compare the percentages
in both listings.
Code

Result

Learning
In this exercise we learn how to get rid of the missing values with ease using different types of formatting techniques.
Creating Tabular Reports
In this section we will learn how to create tables having multiple variables in both columns and rows. This is largely used to create descriptive statistics for final reports
4) We will produce the
following table.
Result


In the first step, we format the variables into 2 sections by Gender. Next we use proc tabulate create a table using Class function and 3 variables. Next we use tables function to multiply Gender and Scholarship to get the desired result.
Learning
We have learnt here how to create tabular reports using proc tabulate. This has helped us summarize the data in one single table instead of multiple tables.
5) We are trying to produce the following table.
Result

Code

Learning
We have learnt how to use descriptive statistics in the tabular format. This is used for reporting research studies.
The following is the link to access the data sets and the code used to create this blogpost - https://drive.google.com/file/d/0B2sVurZ_f97PSWwyQW9aZEFhdk0/view?usp=sharing
No comments:
Post a Comment